User Interface Overview
Phantom Bridge comes with a flexible web-based user interface. It can display autodetected topics either as raw deserialized data, or using visual widgets. Several widget types are built in, you can also easily implement your own. You can call any ROS service or action, set runtime ROS parameters, and completely customize input settings for tele-operation.
Tip
Full configuration of the displayed panels is stored in the URL. Share it with others and they will see exactly what you see, and be able to control the machine.
Most elements are designed to be intuitive and self-explanatory, here are some bits that may need a small introduction:
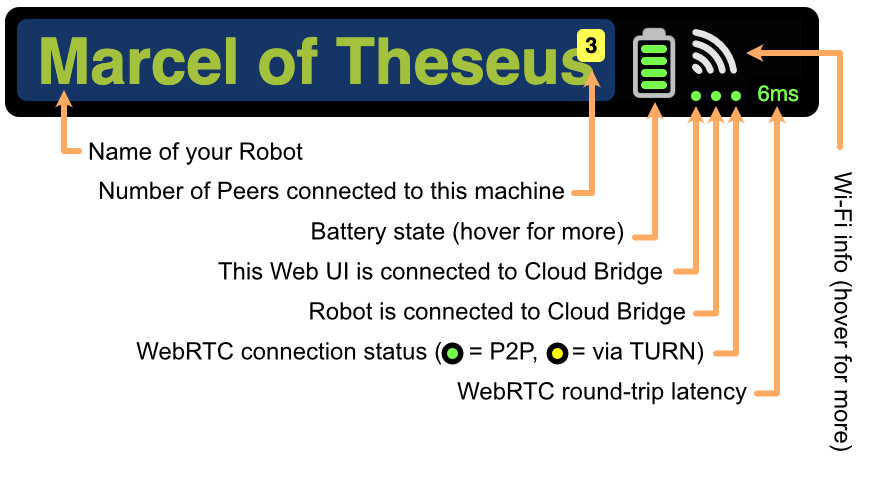
Connection State, Battery & Wi-Fi
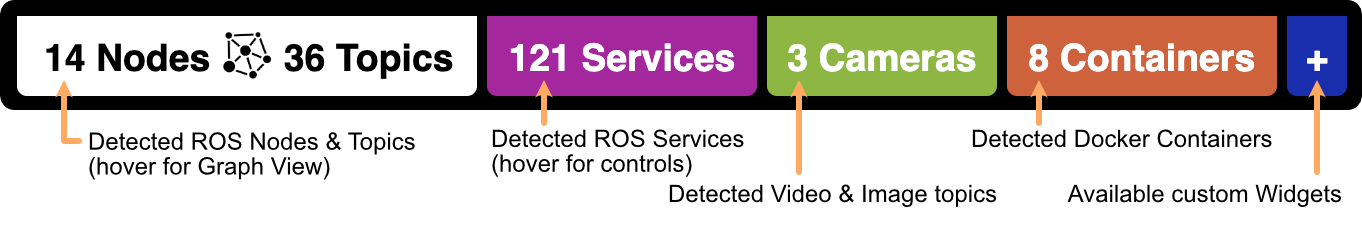
Discovered Resources
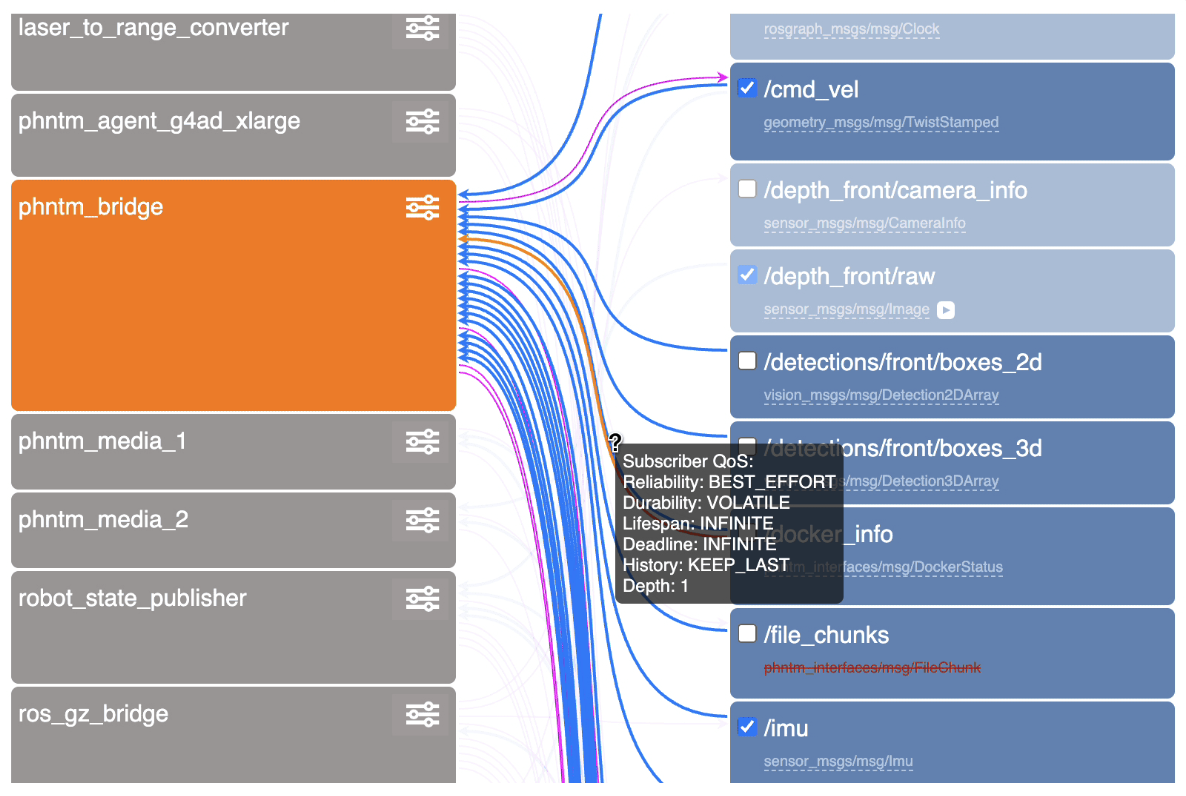
Nodes & Topics (Graph View)
Under the Nodes & Topics menu, you will find the Graph View. On the left you can see all the discovered ROS nodes, on the right all discovered ROS topics. The connections between them signify which nodes publish and subscribe to which topics.
The icon next to the node’s name opens a dialog allowing to examine and modify runtime parameters of the node. The checkbox next to a topic name opens a new panel for the topic. Each connection in the graph shows publisher’s and subscriber’s QoS. A warning is displayed when a QoS mismatch is detected.
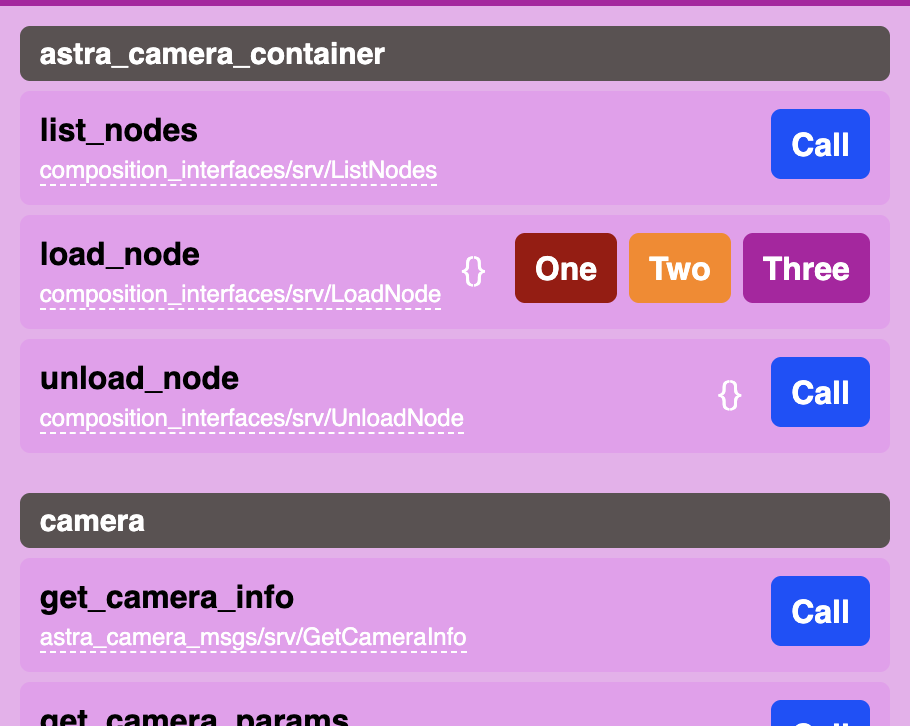
Services & Actions Menu
The menu labelled Services allows you to call any discovered ROS service or action on your system. Some buttons are instantly available, other may need to be configured. You can also make your own custom control widgets. Read more here.
Input Manager
The monkey icon in the top-right corner opens the Input manager. Here you can map input from keyboard, gamepad or touchscreen to ROS messages to be generted in order to tele-operate your ROS machine.
Message Type Inspector
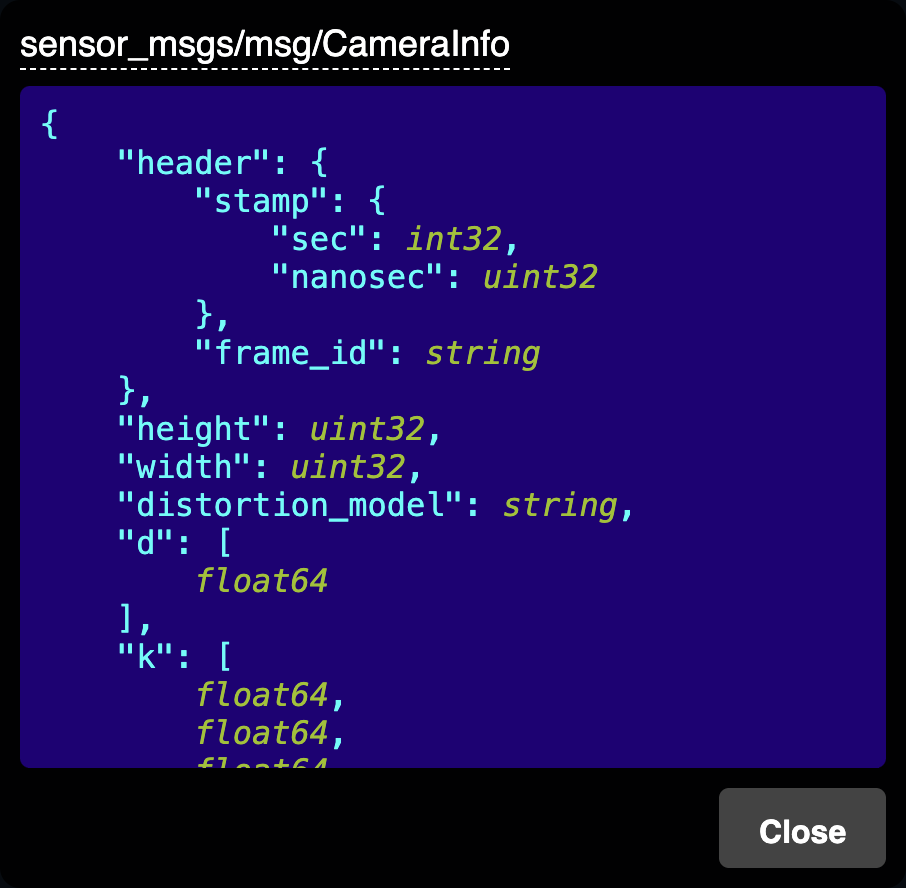
Wherever you see a ROS message or service type (such as sensor_msgs/msg/CameraInfo), you can click on it to reveal its full definition transcribed into a pseudo-JSON, as shown here. This is particularly useful as you don’t need to look up IDL/MSG/SRV type definitions and their nested sub-structures when working with a ROS system.